The given bar graph shows the results of students in a college. Study the graph and answer the question that follows.
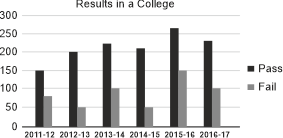
Find the average number of students who failed in the college in the last 5 years, as per the given data.
Show answer & explanation
Correct answer: B
Explanation
The correct answer is Option 2 i.e. 90.
Average number of students who failed in the last 5 years = (50 + 100 + 50 + 150 + 100)/5
= 450/5
= 90