The following bar graph shows the number of deaths from road accidents occurred during the rainy season in the year 1992. Study the graph carefully and answer the question.
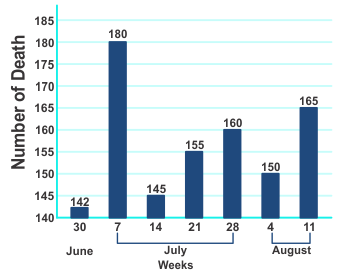
Between which two consecutive weeks was the fall in the number of deaths the greatest?
Show answer & explanation
Correct answer: A
Explanation
The correct answer is option 1 i.e 7 July to 14 July
|
Understanding |
Application |
|
Fall = Initial value – Final value |
Fall from 7 July to 14 July = 180 – 145 = 35 Fall from 21 July to 28 July = 155 – 160 = –5 Fall from 30 June to 7 July = 142 – 180 = –38 Fall from 28 July to 4 August = 160 – 150 = 10 Therefore, fall in the number is greatest from 7 July to 14 July.
|