The given bar graph represents the Percentage of non-electrified villages in 6 states A, B, C, D, E and F. Study the graph and answer the question that follows.
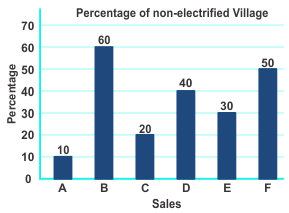
How many states have at most 30% or less non-electrified villages?
Show answer & explanation
Correct answer: A
Explanation
The correct answer is option 1 i.e 3
|
Understanding |
Application |
|
States with at most 30% or less non-electrified villages = A(10%), C(20%) , E(30%). |
Number of states = 3 |