Study the given graph and answer the question that follows.
Production (in thousands) of two types of Vehicles A and B by a company during 2013 to 2018.
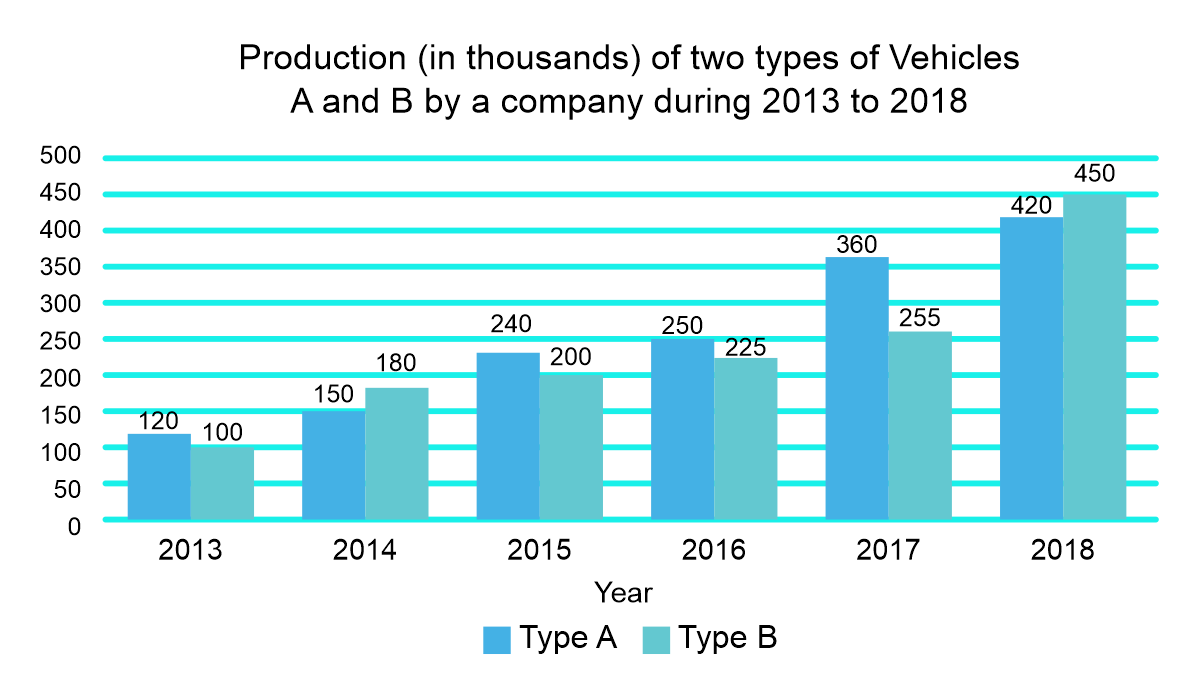
What is the ratio of the total number of vehicles of type A produced in 2015 and 2017 to the total number of vehicles of type B produced in 2016 and 2017?
Show answer & explanation
Correct answer: B
Explanation
The correct answer is option 2 i.e. 5 : 4
Explanation:
According to the given question,
The total number of vehicles of type A produced in 2015 and 2017 = (240 + 360) = 600
The total number of vehicles of type B produced in 2016 and 2017 = (225 + 255) = 480
So, the required ratio = 600 : 480 = 5 : 4
Hence the required answer is 5 : 4.