The given Bar Graph presents the results in terms of the number of students in a school for the five academic years, 2013–2014 to 2017–2018.
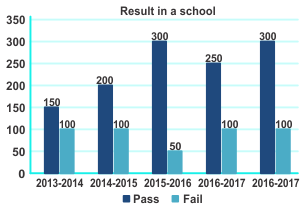
In which year the percentage increase in total number of passed students is the lowest in comparison to its previous academic year?
Show answer & explanation
Correct answer: D
Explanation
Correct Answer is option 4 i.e. 2017–2018
|
Application |
Fair calculation |
|
Percentage increase of passed students as compared to previous year: For year 2016–2017, its decreasing so no need to calculate. For year 2014–2015, = (200 – 150)/150 × 100 = 33.33% For year 2015–2016, = (300 – 200)/200 × 100 = 50% For year 2017–2018, = (300 – 250)/250 × 100 = 20% ∴ For the year 2017–2018, the percentage increase in total number of passed students is the lowest in comparison to previous academic year. |
(200 – 150)/150 × 100 = 500/15 = 33.33 (300 – 200)/200 × 100 = 100/2 = 50 (300 – 250)/250 × 100 = 500/25 = 20
|