The pie chart given below shows the production of 6 different factories. The total production of all these 6 factories is 12000. The production of a particular factory is shown as a percent of the total production of all these 6 factories.
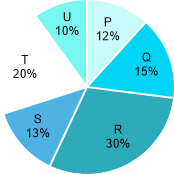
J1 = The value of average production of P and R.
J2 = The value of average production of Q and S.
What is the value of (J1 – J2)?
Show answer & explanation
Correct answer: B
Explanation
The correct answer is Option 2 i.e. 840.
J1 = The value of average production of P and R = (12 + 30)/2 = 21%
J2 = The value of average production of Q and S = (15 + 13)/2 = 14%
J1 - J2 = 7 × 12000/100 = 840