Study the following bar graph and answer the following questions.
The bar graph shows the distribution of marks obtained by students in examinations.
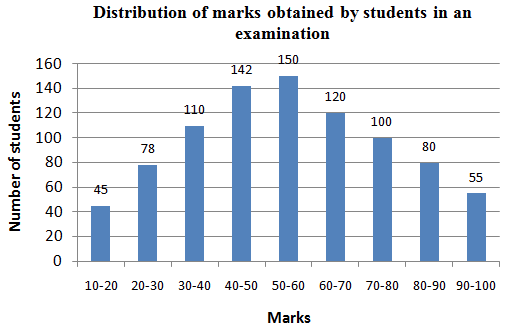
The number of students who obtained 20 marks or more but less than 60 marks is?
Show answer & explanation
Correct answer: C
Explanation
The correct answer is Option 3 i.e. 480
| Application |
|
From the graph, we can see that the number of student interval 20-30 30-40 40-50 50-60 have obtained 20 marks or more but less than 60 marks. So, by adding that we get 78 + 110 + 142 + 150 = 480. |