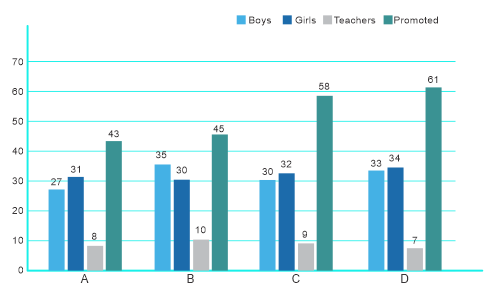
The given bar-graph shows the number of boys and girls in classes A, B, C and D in a school, the number of teachers alloted to each class and the number of students promoted to the next class.
Which class has the highest percentage of failed students?
Show answer & explanation
Correct answer: B
Explanation
The correct answer is Option 2 i.e. B.
The failed students in a class = Boys + Girls - Promoted students
According to the question
% of failed students
In class A = {(27 + 31) - 43}/58 = (15/58) * 100 = 25.82%
In class B = {(35 + 30) - 45}/65 = (20/65) * 100 = 30.76%
In class C = {(30 + 32) - 58}/62 = (4/62) * 100 = 6.45%
In class D = {(33 + 34) - 61}/67 = (5/67) * 100 = 7.46%
Hence, In class B = 30.76 % highest percentage of failed students