The given bar graph shows the number of students enrolled in institutes A and B during 5 years (2014 to 2018). Study the bar graph and answer the question that follows.
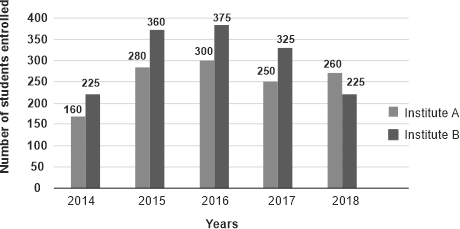
What is the difference between the average number of students enrolled in Institute B during the five years and the average number of students enrolled in Institute A during the five years?
Show answer & explanation
Correct answer: B
Explanation
The correct answer is option 2 i.e. 52.
Average number of students enrolled in Institute B = (225 + 360 + 375 + 325 + 225)/5 = 302
Average number of students enrolled in Institute A = (160 + 280 + 300 + 250 + 260)/5 = 250
Difference = 302 - 250 = 52