Study the given table and answer the question that follows. The table shows the production of different types of cars A, B, C, D, and E (in thousands) from 2012 to 2016.
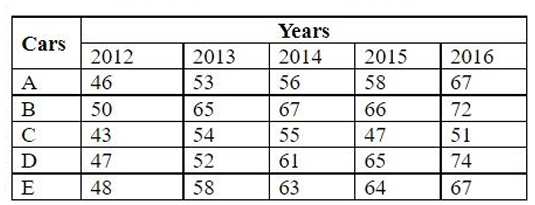
What is the ratio of the total production of type A cars in 2014 and type E cars in 2015 to the total production of type C and D cars in 2012?
Show answer & explanation
Correct answer: C
Explanation
The correct answer is option 3 i.e. 4 : 3.
Total production of type A cars in 2014 and type E cars in 2015 = 56 + 64 = 120 thousand
Total production of type C and D cars in 2012 = 43 + 47 = 90 thousand
Ratio = 120 : 90 = 4 : 3