The given bar graph shows the income and expenditure ( in crores Rs) of a company over 5 years , from 2014 to 2018. Study the bar graph and answer the question that follows.
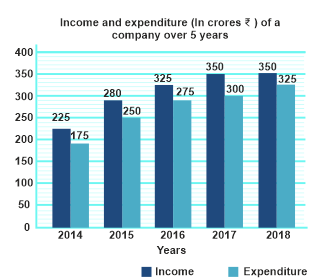
In which of the following years the ratio of expenditure to income is the lowest?
Show answer & explanation
Correct answer: D
Explanation
The correct answer is option 4 i.e. 2014
Ratio for 2014 = 175/275 = 0.63
Ratio for 2015 = 250/280 = 0.89
Ratio for 2016 =275/325 = 0.84
Ratio for 2017 =300/350 = 0.85
Ratio for 2018 = 325/350 = 0.92
The ratio of expenditure to income will be minimal for 2014.