The given bar graph shows the imports and exports (in crores) of steel by a country from 2013 to 2017.
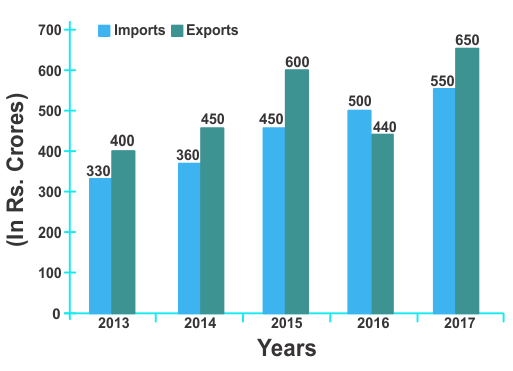
The total imports of steel in 2014, 2016 and 2017 is what percent less than the total exports in 2013, 2015 and 2017 ? (correct to one decimal place)
Show answer & explanation
Correct answer: D
Explanation
The correct answer is option 4 ie 14.5
I14 + 16 + 17 E13 + 15 + 17
1410 1650
(24/165) × 100 = 14.5%