The following pie chart shows the ratio of the number of imports by a company to the number of exports from that company from 2013 to 2019.
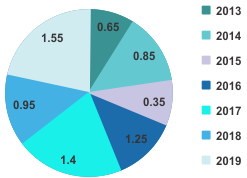
If the imports in 2016 were Rs.250 million and the total exports in the years 2016 and 2017 together were Rs.500 million then the imports in 2017 were:
Show answer & explanation
Correct answer: C
Explanation
The correct answer is option 3 i.e Rs.420 million
Let the number of export in 2016 be 'x' Rs. million and the number of imports in 2017 be 'y' Rs. million.
⇒ Ratio for 2016 = 1.25 = 250 / x
⇒ x = 250 / 1.25 = 200 Rs. million
Total export is year 2016 and 2017 combined = 500
⇒ Total exports in year 2017 = 500 - 200 = 300 Rs. million
⇒ Ratio for 2017 = 1.4 = y / 300
⇒ y = 300 × 1.4 = 420 Rs. million