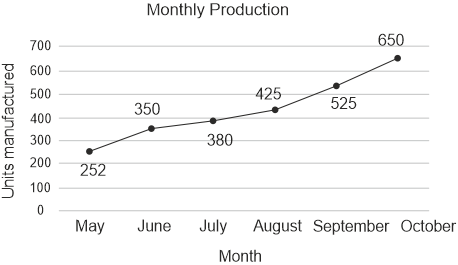
The following line graph shows the units manufactured by a company in some months. In which month did the company report the highest growth (in %) in production as compared with the respective previous month’s production?
Show answer & explanation
Correct answer: C
Explanation
The correct answer is option 3 i.e. June.
Growth of production in June from May = 350 - 252 = 98
Growth percentage = (98/252) × 100 ≈ 38.89% [Highest]
Growth of production in July from June = 380 - 350 = 30
Growth percentage = (30/350) × 100 ≈ 8.57%
Growth of production in August from July = 425 - 380 = 45
Growth percentage = (45/380) × 100 ≈ 11.84%
Growth of production in September from August = 525 - 425 = 100
Growth percentage = (100/425) × 100 ≈ 23.53%
Growth of production in October from September = 650 - 525 = 125
Growth percentage = (125/525) × 100 ≈ 23.81%
The highest percentage growth in production occurred in June.