The following graph shows the wheat imports (in thousand tonnes) over the five years:
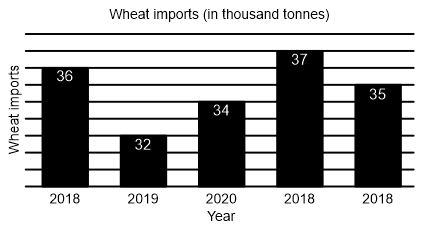
What is the ratio of the years which have below-average imports to those which have above-average imports?
Show answer & explanation
Correct answer: C
Explanation
The correct answer is option 3 i.e. 2 : 3.
Average Wheat import = ( 36 + 32 + 34 + 37 + 35)/5
⇒ 174/5 = 34.8 thousand tonnes
Required Ratio = 2: 3