Study the given bar-graph and answer the question that follows.
The bar-graph shows the production of refrigerators (in thousand) by five different companies A, B, C, D and E during 2004 to 2007.
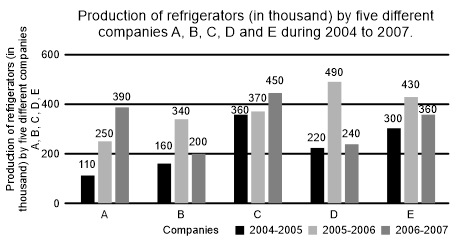
What is the difference between 60% of the average production of refrigerators by all the companies for the year 2005-2006 and 70% of the average of all the companies in 2006-2007?
Show answer & explanation
Correct answer: A
Explanation
The correct answer is option 1 i.e. 4000.
2005-2006 = 60% of (( 250000 + 340000+370000+ 490000 + 430000)/5)
⇒3/5 × 3760000 = 225600
2006-2007 = 70% of (( 390000 + 200000+ 450000+ 240000+ 360000)/5)
⇒ 7/10 × 328000 = 229600
Difference = 229600 - 225600 = 4000.