The following graph shows the profit (in crore Rs.) earned by a company in the years from 2012 to 2019.
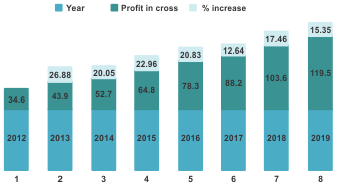
The percentage increase in the profit from the previous year, is greatest in the year:
Show answer & explanation
Correct answer: D
Explanation
The correct answer is option 4 i.e 2013
| Understanding/Application |
|
Given, years 2013, 2017, 2015 and 2018 In 2013 profit % = 26.88% In 2017 profit % = 12.64% In 2015 profit % = 22.96% In 2018 profit % = 17.46% So we can clearly see profit increment in 2013 is greater than in other years. |