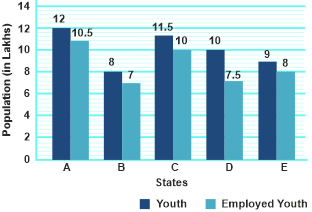
The following bar graph shows the total number of youth (in lakhs) and the number of employed youth (in lakhs) in 5 states A, B, C, D and E.
How many youth (in lakhs) are unemployed in states B and D taken together?
Show answer & explanation
Correct answer: A
Explanation
The correct answer is option 1 i.e. 3.5
The following bar graph shows the total number of youth (in lakhs) and the number of employed youth (in lakhs) in 5 states A, B, C, D, and E.
The unemployed youth in state B (in lakhs) = 8 - 7 = 1
The unemployed youth in state D (in lakhs) = 10 - 7.5 = 2.5
Total unemployed youth in states B and D taken together = 1 + 2.5 = 3.5