The following bar graph represents the number of CCTV cameras manufactured by a company over six years, study the graph carefully and answer the question that follows.
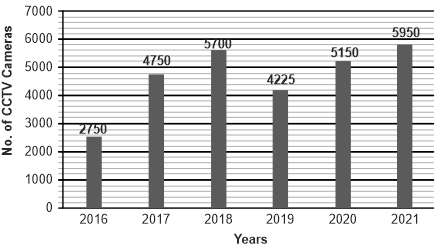
What is the ratio of the total number of CCTVs cameras manufactured by the company in the year of 2016-17 to the total number of CCTV cameras manufactured in the year of 2020-21?
Show answer & explanation
Correct answer: D
Explanation
The correct answer is option 4 i.e. 25 : 37.
According to the given graph,
Total number of Cameras manufactured in 2016 and 2017 = 2750 + 4750 = 7500
Total number of cameras manufactured in 2020 and 2021 = 5150 + 5950 = 11100
Now, rewuired ratio = 7500 : 11100
⇒ 25 : 37