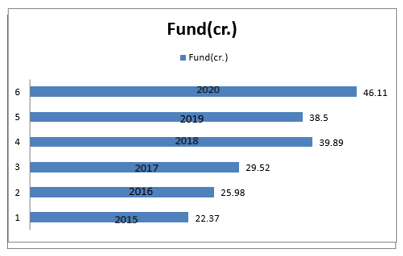
The following bar graph represents the flow of funds of XYZ India Pvt. Ltd from 2015-2020. Calculate the percentage of average rate (approx.) of the increase in funds from 2015-2017.
Show answer & explanation
Correct answer: D
Explanation
The Solutions will be uploaded soon