The following bar graph represents the annual results of five classes (VI to X) of a school. Study the bar graph carefully and answer the question given below:
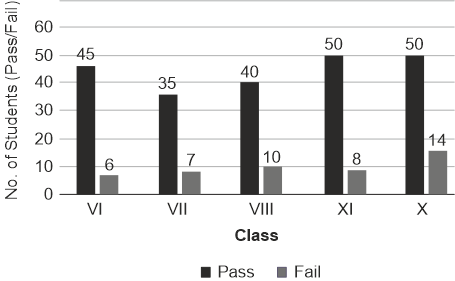
What is the average number of students in the given five classes?
Show answer & explanation
Correct answer: C
Explanation
The correct answer is Option 3 i.e. 53.
Total number of students in class VI = 45 + 6 = 51
Total number of students in class VII = 35 + 7 = 42
Total number of students in class VIII = 40 + 10 = 50
Total number of students in class IX = 50 + 8 = 58
Total number of students in class X = 50 + 14 = 64
Total number of students = 51 + 42 + 50 + 58 + 64 = 265
Average = = 53