Directions: The bar graph below shows the production of coffee (in lakh tons) by four companies A, B, C, and D over four years from 2010 to 2013. Study the graph and answer the question that follows.
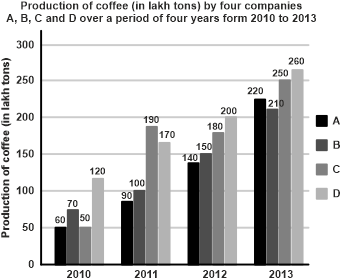
The combined average production for four years of companies A and C is what percentage (rounded off to 2 decimal places) is more/less than the combined average production for four years of companies B and D?
Show answer & explanation
Correct answer: A
Explanation
The correct answer is Option 1 i.e. Less, 7.81%.
We know that,
Average = Sum of observations/Number of observations
The combined production of Company A and C = 60 + 50 + 90 + 190 + 140 + 180 + 220 + 250 = 1180
Average = 1180/8 = 147.5
The combined production of Company B and D = 70 + 120 + 100 + 170 + 150 + 200 + 210 + 260 = 1280
Average = 1280/8 = 160
Difference = 160 - 147.5 = 12.5
Required percentage = 12.5/160 × 100 = 7.81 less