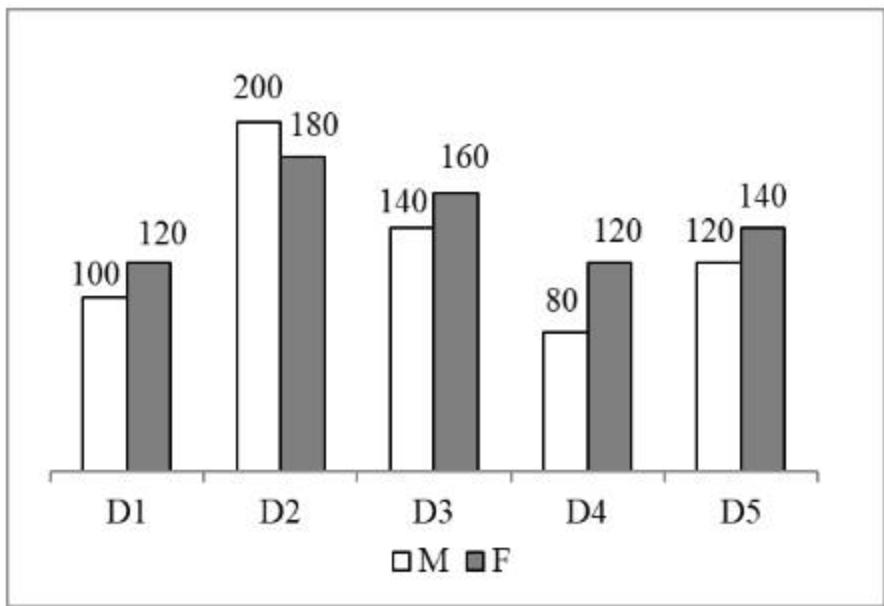
The bar graph given below shows the number of males (M) and females (F) working in 5 departments of a company.
In which department total number of males and females together are maximum?
Show answer & explanation
Correct answer: D
Explanation
Given:
D1 → M = 100, F = 120
D2 → M = 200, F = 180
D3 → M = 140, F = 160
D4 → M = 80, F = 120
D5 → M = 120, F = 140
According to the formula:
Total = Men + Women
D1 = 100 + 120 = 220
D2 = 200 + 180 = 380
D3 = 140 + 160 = 300
D4 = 80 + 120 = 200
D5 = 120 + 140 = 260
Maximum = 380 (D2)