The bar chart given below shows the ratio of expenditure to revenue for seven consecutive years Y1, Y2, Y3, Y4, Y5, Y6 and Y7.
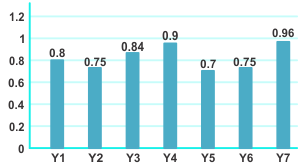
In which year is the-profit highest?
Show answer & explanation
Correct answer: C
Explanation
The correct answer is option 3 i.e. Cannot be determined
Without knowing the exact value of revenue and expenditure we cannot determine the profit