Study the graph given and answer the question that follows.
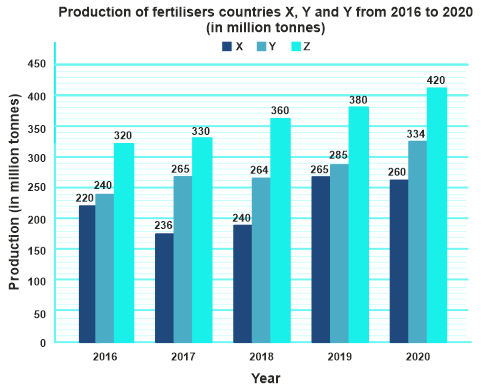
The average production of fertilizers by country Z in 2017,2018 and 2020 is what percentage more than the average production of fertilizers by country X in 2018 and 2020?
Show answer & explanation
Correct answer: C
Explanation
The correct answer is option 3 i.e. 48%
The average production of fertilizers by country Z in 2017,2018 and 2020 = (330 + 360 + 420) = 1110/3 = 370
The average production of fertilizers by country X in 2018 and 2020 = (240 + 260)/2 = 250
Required % = (370 - 250)/250 × 100 = 48%