Study the given pie - charts and answer the question that follows.
The given pie chart represents the popularity of ice-cream flavours in the year 2005.
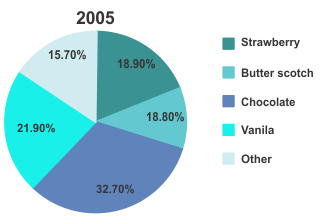
In 2005, if 40% of the 'other' category is mix fruit flavour and 1570 people surveyed preferred mix fruit flavour, then how many people were surveyed?
Show answer & explanation
Correct answer: A
Explanation
The correct answer is option 1 i.e. 25,000.
Let the total number of people be x
People eating other flavoured ice cream = 15.7% of x
⇒ People eating other flavoured ice cream = 0.157x
People having mix flavoured ice cream = 40% of 0.157x
⇒ People having mix flavoured ice cream = 0.0628x
According to question 0.0628x = 1570
⇒ x = 1570 ÷ 0.0628
⇒ x = 25000