Study the given pie chart and answer the question that follows.
The pie chart represents the popularity of ice cream flavours among families in the year 2019.
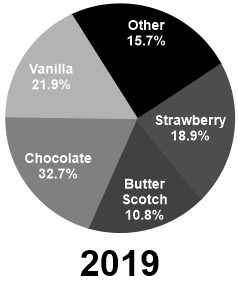
In 2019, if 20% of the 'other' category was Anjeer flavor and 4082 people preferred Anjeer flavor, then how many people were surveyed?
Show answer & explanation
Correct answer: A
Explanation
The correct answer is option 1 i.e. 130000
Let the number of people surveyed = x
According to the question;
⇒ x × 15.7% = 'Other' category
Number of people liking Anjeer flavour = 4082
⇒ (x × 15.7%) × 20% = 4082
⇒ x × 157/1000 × 20/100 = 4082
⇒ x × 157/1000 × 1/5 = 4082
⇒ x = (4082 × 1000 × 5)/157
⇒ x = 130000