Study the given graph and answer the question that follows.
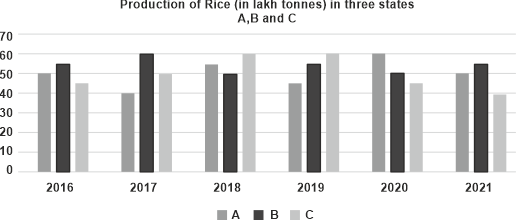
During 2016 to 2021, which year was the production of rice highest?
Show answer & explanation
Correct answer: C
Explanation
The correct answer is option 3 i.e. 2018.
Total production of each year:
2016: 50 + 55 + 45 = 150
2017: 40 + 60 + 50 = 150
2018: 55 + 50 + 60 = 165 [Highest]
2019: 45 + 55 + 60 = 160
2020: 60 + 50 + 45 = 155
2021: 50 + 55 + 40 = 145