Study the given graph and answer the question that follows.
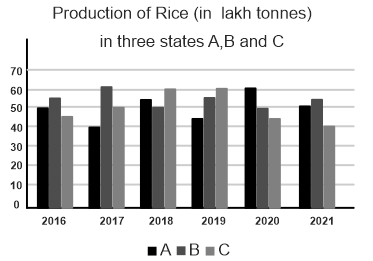
The total rice production of state A in 2016 and 2017 is what percentage of the total rice production of state C in 2018 and 2019?
Show answer & explanation
Correct answer: D
Explanation
The correct answer is Option 4 i.e. 75%.
Total rice production of state A in 2016 and 2017 = 50 + 40 = 90 lakh tonnes
Total rice production of state C in 2018 and 2019 = 60 + 60 = 120 lakh tonnes
Percentage = (90/120) × 100 = 75%