Study the given graph and answer the question that follows.
The graph shows the number of projects completed by five companies
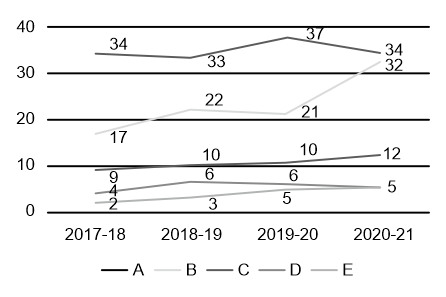
Which company has the highest growth in percentage in completed projects from 2017-18 to 2020-21?
Show answer & explanation
Correct answer: B
Explanation
The correct answer is option 2 i.e. E.
Growth percentage of each company:
Company A = [(34 - 34)/34] × 100 = 0%
Company B = [(32 - 17)/17] × 100 ≈ 88.24%
Company C = [(12 - 9)/9] × 100 ≈ 33.33%
Company D = [(5 - 4)/4] × 100 = 25%
Company E = [(5 - 2)/2] × 100 = 150% [Highest]