Study the given graph and answer the following question.
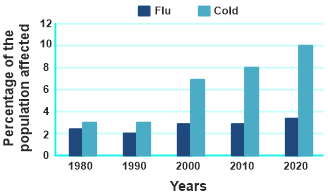
As per data available above in which of the given years was the percentage of the population affected by flu the minimum?
Show answer & explanation
Correct answer: B
Explanation
The correct answer is Option 2 i.e.1990.
Explanation:
Since the data in the chart is given in terms of percentage, Then
The year in which the percentage of population affected by flu is minimum in 1990.
HEnce the required answer is 1990.