Study the given graph and answer the following question.
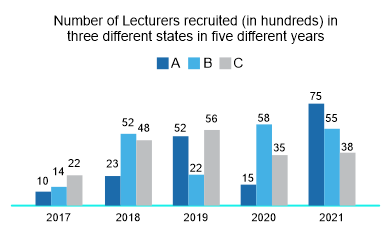
The number of lecturers recruited in state A in the year 2017 was what percentage of the number of lecturers recruited in state B in the year 2019? (Correct to 2 decimal places)
Show answer & explanation
Correct answer: C
Explanation
The correct answer is option 3 i.e. 45.45%.
The number of lecturers recruited in state A in the year 2017 = 1000
The number of lecturers recruited in state B in the year 2019 = 2200
Required percentage = 1000/2200 × 100 = 45.45%