Study the given bar graph and answer the question that follows.
The following bar graph shows the number of deaths that happened in cities 1, 2, 3 and 4 in the months mentioned.
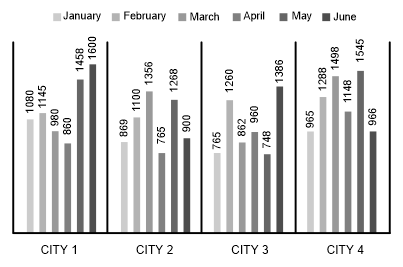
The average number of deaths that occurred during April across all the cities (rounded off to the next integer) is:
Show answer & explanation
Correct answer: B
Explanation
The correct answer is option 2 i.e. 934.
Total number of deaths that occurred during April = 860 + 765 + 960 + 1148 = 3733
Total number of cities = 4
Average = 3733/4 = 933.25 = 934 (rounded off to the next integer)
Therefore, the average number of deaths that occurred during April across all the cities is 934.