Study the given bar-graph and answer the question that follows. The bar-graph represents the voting for class monitor in class 9.
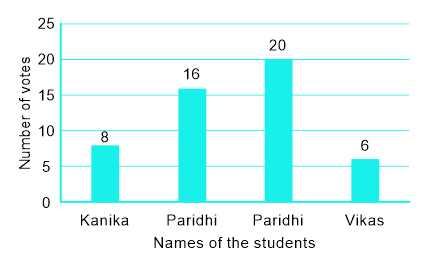
In percentage figures how many more votes did Vaibhav get than Paridhi?
Show answer & explanation
Correct answer: A
Explanation
The correct answer is option 1 i.e. 25 per cent
Percentage of votes Vaibhav got more than Paridhi =
Percentage of votes Vaibhav got more than Paridhi = = 25%