Study the given bar-graph and answer the question that follows.
The bar-graph shows the export of rice (in Rs. lakh) during five years.
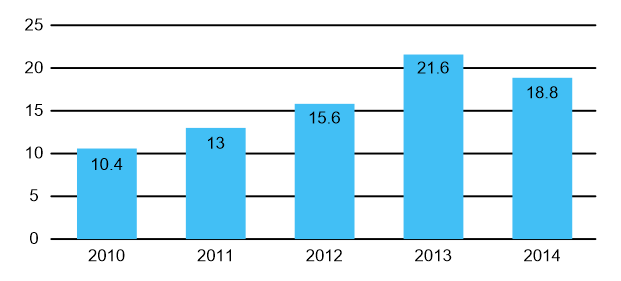
In how many years was the export of rice less than the average export for the five-year period?
Show answer & explanation
Correct answer: C
Explanation
The correct answer is option 3 i.e. 3
Total export in the given above years = 10.4 + 13 + 15.6 + 21.6 + 18.8 = 79.4
Formula used
Average = Total sum/total numbers
Calculation
The average of export of rice = 79.4/5 = 15.88
Hence, the export of rice less than the average in 2010, 2011, 2012 i.e. 3