Study the given bar chart and answer the question that follows.
Production of Fertilizers by a Company (in 10,000 tonnes) Over the Years
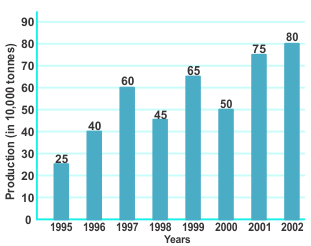
The average production in 2000 and 2001 was less than the average production of which of the following pairs of years?
Show answer & explanation
Correct answer: A
Explanation
The correct answer is option 1 i.e 2001 and 2002
In Option 1 the year 2001 is common and we saw from the table that production in 2002 > 2000 so the sum would be greater in case of 2002.
Average production in 2000 & 2001 = (50 + 75) / 2 = 62.5
Average production in 2001 & 2002 = (75 + 80) / 2 = 77.5
Average production in 1997 & 1998 = (60 + 45) / 2 = 52.5
Average production in 1999 & 2000 = (65 + 50) / 2 = 57.5
Average production in 1996 & 1997 = (40 + 60) / 2 = 50
We could say that in 2001 & 2002 only production is greater.