Direction: The given bar graph presents income and expenditure (in crores of rupees) of a company for the five years, 2014 to 2018.
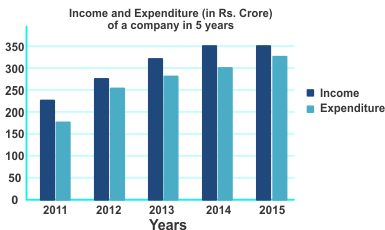
In which year is expenditure more than 40% as compared to the Expenditure in the previous year?
Show answer & explanation
Correct answer: D
Explanation
Correct Answer is option 4 i.e. 2015
|
Understanding |
Application |
|
In the graph, we can observe that the possibility of having expenditure more than 40% from previous year is high in 2015 only. So we need to check it first. |
Expenditure in year 2014 = 175 Expenditure in year 2015 = 250 Percentage increment = (250 - 175) × 100/175 = 42.85% Hence, 2015 is the correct answer. |