Directions: The given Bar Graph presents the Target and Actual production of AC Machines (numbers in thousand) of a factory over five months.
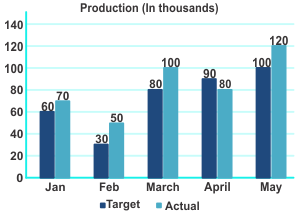
In which month the actual production of AC Machines was 25% more than the target production?
Show answer & explanation
Correct answer: A
Explanation
The correct answer is option 1 i.e. March
|
Application |
|
Jan: Percentage increase = [(70 – 60)/60] × 100 = 100/6 = 16.67% Feb: Percentage increase = [(50 – 30)/30] × 100 = 200/3 = 66.67% March: Percentage increase = [(100 – 80)/80] × 100 = 200/8 = 25% May: Percentage increase = [(120 – 100)/100] × 100 200/10 = 20% Hence, 25% increase in the month of March. |