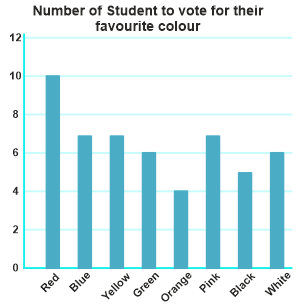
As per data on the basis of which the following bar graph has been constructed, how many students were surveyed?
Show answer & explanation
Correct answer: C
Explanation
The correct answer is Option 3 i.e. 52.
The total number of students who were surveyed = Total number of students who voted for their favourite colour = (10 + 7 + 7 + 6 + 4 + 7 + 5 + 6) = 52