The given Bar Graph presents the number of different types of vehicles (in lakhs) exported by a company during 2014 and 2015.
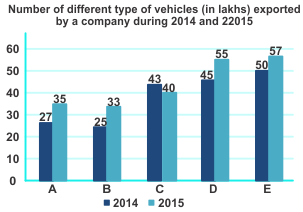
Which type of vehicle showed 32% increase in export in 2015 as compared to that in the previous year?
Show answer & explanation
Correct answer: D
Explanation
Correct Answer is option 4 i.e. B
|
Application |
Fair calculation |
|
For A: [(35 – 27)/27] × 100 = 29.62% For B: [(33 – 25)/25] × 100 = 32% For C: Decreasing not increasing For D: [(55 – 45)/45] × 100 = 22.22% For E: [(57 – 50)/50] × 100 = 14%
Hence, vehicle B. |
[(35 – 27)/27] × 100 = 800/27 = 29.62% [(33 – 25)/25] × 100 = 800/25 = 32% [(55 – 45)/45] × 100 = 1000/45 = 22.22% [(57 – 50)/50] × 100 = 700/50 = 14% |