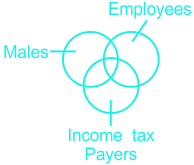
Which of the following venn diagram best represent the relationship between the following classes?
Income tax payers, Employees, Males
Show answer & explanation
Correct answer: B
Explanation
The correct answer is Option 2
| Understanding |
|---|
|
The possible Venn diagram is:
Some males are employees and also some males are income taxpayers. Some income taxpayers are also employees. Hence, the diagram given above shows the best relationship between them. Hence, the correct answer is option 2. |