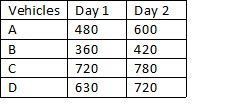
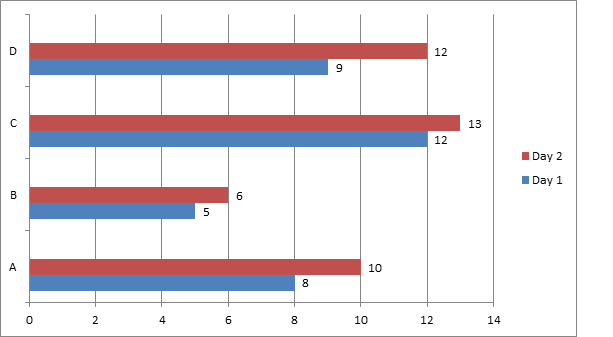
The following table indicates the distances (in km) travelled by 4 vehicles (A, B, C and D) in 2 days and the bar graph indicates the time (in hours) taken by the vehicles to travel the distances, respectively. The x - axis indicates the time (in hours) and the y - axis indicates the vehicles. Study the bar graph carefully and answer the question that follows.
Time taken by 4 vehicles to travel thedistances.
Which of the following vehicles travelled at the same speed on both the days?
Show answer & explanation
Correct answer: B
Explanation
The correct answer is option 2 i.e Only A and C.
Vehicle A:
Day 1: 480 km in 8 hours → 480 ÷ 8 = 60 km/h
Day 2: 600 km in 10 hours → 600 ÷ 10 = 60 km/h (Same speed)
Vehicle B:
Day 1: 360 km in 5 hours → 360 ÷ 5 = 72 km/h
Day 2: 420 km in 6 hours → 420 ÷ 6 = 70 km/h (Different speed)
Vehicle C:
Day 1: 720 km in 12 hours → 720 ÷ 12 = 60 km/h
Day 2: 780 km in 13 hours → 780 ÷ 13 = 60 km/h (Same speed)
Vehicle D:
Day 1: 630 km in 9 hours → 630 ÷ 9 = 70 km/h
Day 2: 720 km in 12 hours → 720 ÷ 12 = 60 km/h (Different speed)
Hence, Vehicles A and C travelled at the same speed on both days.