The given bar graph shows the income and expenditure (in thousand ₹) of a family in four different years.
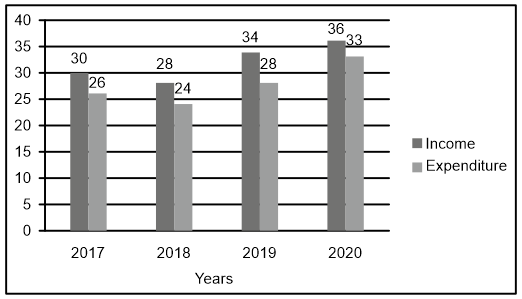
What percentage, more or less, is the total savings of the family in the last two years (2019 and 2020) when compared to the total savings of the family in the initial two years (2017 and 2018)?
(Savings = Income – Expenditure)
Show answer & explanation
Correct answer: A
Explanation
The correct answer is option 1 i.e 12.5% more.
Savings = Income – Expenditure
2017: 30 – 26 = 4
2018: 28 – 24 = 4
2019: 34 – 28 = 6
2020: 36 – 33 = 3
Initial two years (2017 + 2018) = 4 + 4 = 8
Last two years (2019 + 2020) = 6 + 3 = 9
Now, Difference = 9 – 8 = 1
Percentage = (1 ÷ 8) × 100 = 12.5% more