Directions: The bar graph shows the number of students enrolled in Institutes A and B for 5 years (2018 to 2022).
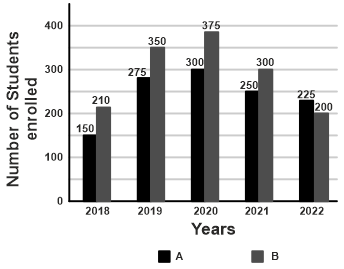
What is the ratio of the total students enrolled in Institute B in 2019, 2020, and 2022 to that of the total students enrolled in Institute A in 2018, 2020, and 2021?
Show answer & explanation
Correct answer: A
Explanation
The correct answer is Option 1 i.e. 37 : 28.
The total number of students enrolled in Institute B in 2019, 2020, and 2022 = 350 + 375 + 200 = 925
The total number of students enrolled in Institute A in 2018, 2020, and 2021 = 150 + 300 + 250 = 700
The required ratio = 925 : 700 = 37 : 28