The following graph shows the data on the production of electric wire (in thousand tons) by different companies P,Q and R over the years.
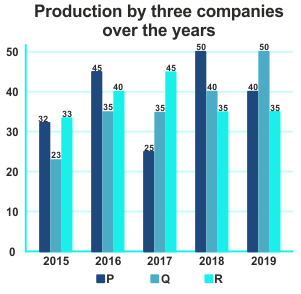
What is the ratio of the average production of Company P in the period 2017-2019 to the average production of Company Q in the same period?
Show answer & explanation
Correct answer: C
Explanation
The correct answer is option 3 i.e. 23 : 25.
Average = Sum of observations/Number of observations
Required ratio = Average production of company P in the year 2017 - 2019 : Average production of company Q in the year 2017 - 2019
Ratio = [(25 + 50 + 40)/3] : [(35 + 40 + 50)/3] = 115 : 125 = 23 : 25