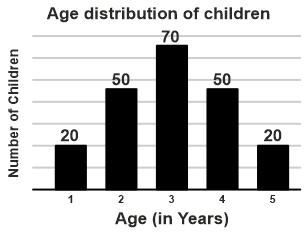
Directions: The graph given represents data on the ages of various children. Study the given graph and answer the following question.
What is the difference between the mean and mode of the ages?
Show answer & explanation
Correct answer: D
Explanation
The correct answer is option 4 i.e. 0.
The sum of ages = 1 × 20 + 2 × 50 + 70 × 3 + 50 × 4 + 20 × 5
= 20 + 100 + 210 + 200 + 100 = 630
Total number of children = 20 + 50 + 70 + 50 + 20 = 210
Mean = 630/210 = 3
Mode = 3 [highest frequency]
So, the difference between the mean and mode of the ages = 3 - 3 = 0