Study the given graph and answer the question that follows.
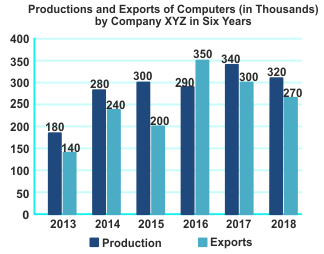
The total production of computers in 2013, 2015 and 2018 is x% of the total exports of computers by the company during the six years. The value of x is :
Show answer & explanation
Correct answer: C
Explanation
The correct answer is option 3 i.e. 53
The total production of computers in 2013, 2015 and 2018 = 800
The total exports of computers by the company during the six years = 1500
x = 800/1500 × 100 = 53%.