The table below shows the production (in tonnes) of four types of crops in five consecutive years.
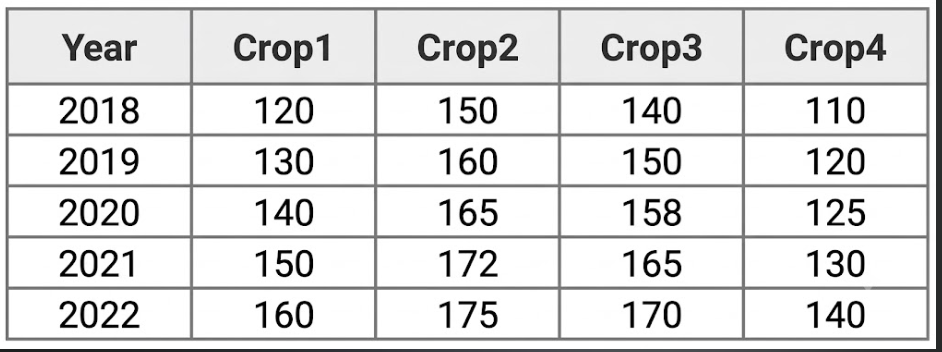
Based on the data, in which year was the percentage increase in total production compared to the previous year the highest?
Show answer & explanation
Correct answer: C
Explanation
Calculate the total production for each year:
• 2018: 120 + 150 + 140 + 110 = 520 tonnes
• 2019: 130 + 160 + 150 + 120 = 560 tonnes
• 2020: 140 + 165 + 158 + 125 = 588 tonnes
• 2021: 150 + 172 + 165 + 130 = 617 tonnes
• 2022: 160 + 175 + 170 + 140 = 645 tonnes
Now, calculate the percentage increase compared to the previous year:
• 2019: 560−520520×100=40520×100≈7.69%
• 2020: 588−560560×100=28560×100=5.00%
• 2021: 617−588588×100=29588×100≈4.93%
• 2022: 645−617617×100=28617×100≈4.54%
The percentage increase was highest in 2019.
Therefore, the correct option is (C).