Study the given graph and answer the question that follows:
The graph shows the production of fertilizers by countries X, Y and Z (in million tonnes) from the year 2016 to 2020.
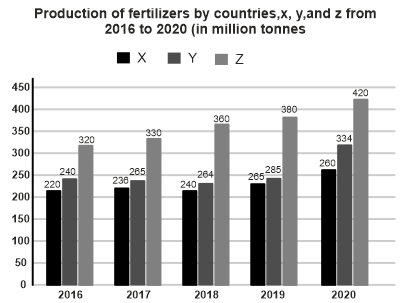
The ratio of the production of fertilizers by country Z in 2019 to the total production of fertilizers by country X in 2017 and country Y in 2020 is:
Show answer & explanation
Correct answer: B
Explanation
The correct answer is option 2 i.e. 2 : 3.
Production of fertilizers by Country Z in 2019 = 380 million tonnes
Total production of fertilizers by country X in 2017 and country Y in 2020 = 236 + 334 = 570 million tonnes
Ratio = 380 : 570 = 2 : 3