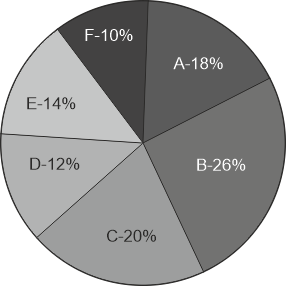
The Pie chart shows the percentage distributions of total number of laptops (both Dell and HP) sold by six stores in March. Refer to the pie chart and table carefully and answer the given questions.
Total number = 11200
| Ratio of the numbers of Dell and HP sold | |
| Stores | Ratio |
| A | 5 : 4 |
| B | 7 : 6 |
| C | 1 : 4 |
| D | 11 : 10 |
| E | 4 : 3 |
| F | 3 : 1 |
What is the ratio of the number of Dell laptops sold by A to that of the HP laptops sold by stores C and D together?
Show answer & explanation
Correct answer: B
Explanation
The correct answer is option 2 i.e. 35 : 76.
According to the given question,
Total number of laptops sold by store A = 18% of 11200
⇒ 11200 × 18/100 = 2016
Number of Dell laptops sold by store A = [2016/(5 + 4)] × 5
⇒ 224 × 5 = 1120
Total number of laptops sold by store C = 20% of 11200
⇒ 11200 × 20/100 = 2240
Number of HP laptops sold by store C = [2240/(1 + 4)] × 4
⇒ 448 × 4 = 1792
Total number of laptops sold by store D = 12% of 11200
⇒ 11200 × 12/100 = 1344
Number of HP laptops sold by store D = [1344/(11 + 10)] × 10
⇒ 64 × 10 = 640
Required ratio = 1120 : (1792 + 640)
⇒ 1120 : 2432 = 35 : 76